MemProcFS (Part 1)

Annotations and quick copy-pastes for MemprocFS, based on 13Cubed’s tutorial. I don’t see a whole lot of other people using this tool but it has been useful so I guess here we are.
TLDR SpeedRun
Commands
1
2
3
4
5
6
7
8
9
10
11
12
13
14
15
16
17
18
19
20
21
22
> MemProcFS.exe -device memdump.vmem -forensic 1
/sys/proc
- pstree output
/sys/net
- netstat output
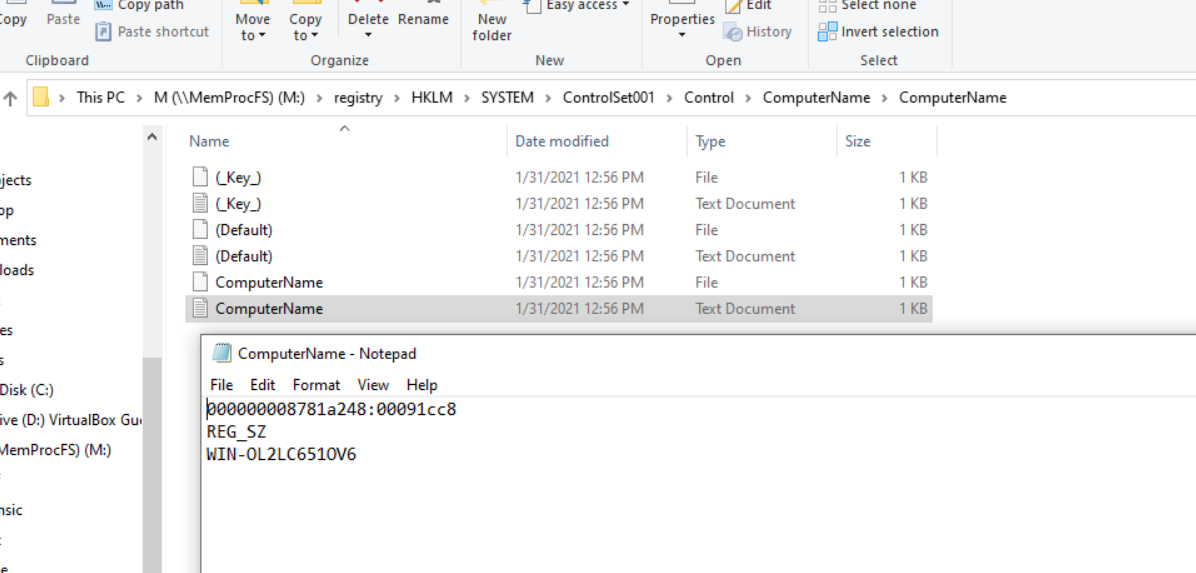
/registry/HKLM/SYSTEM/ControlSet001/Control/ComputerName
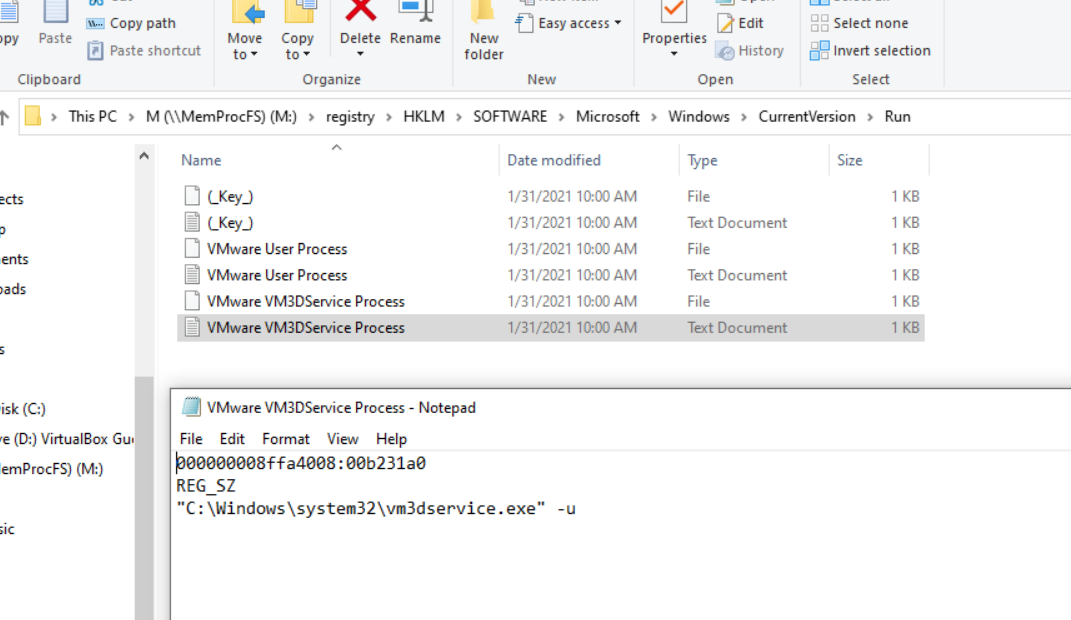
/registry/HKLM/Software/Microsoft/Windows/Current Version/Run
/registry/hive_files
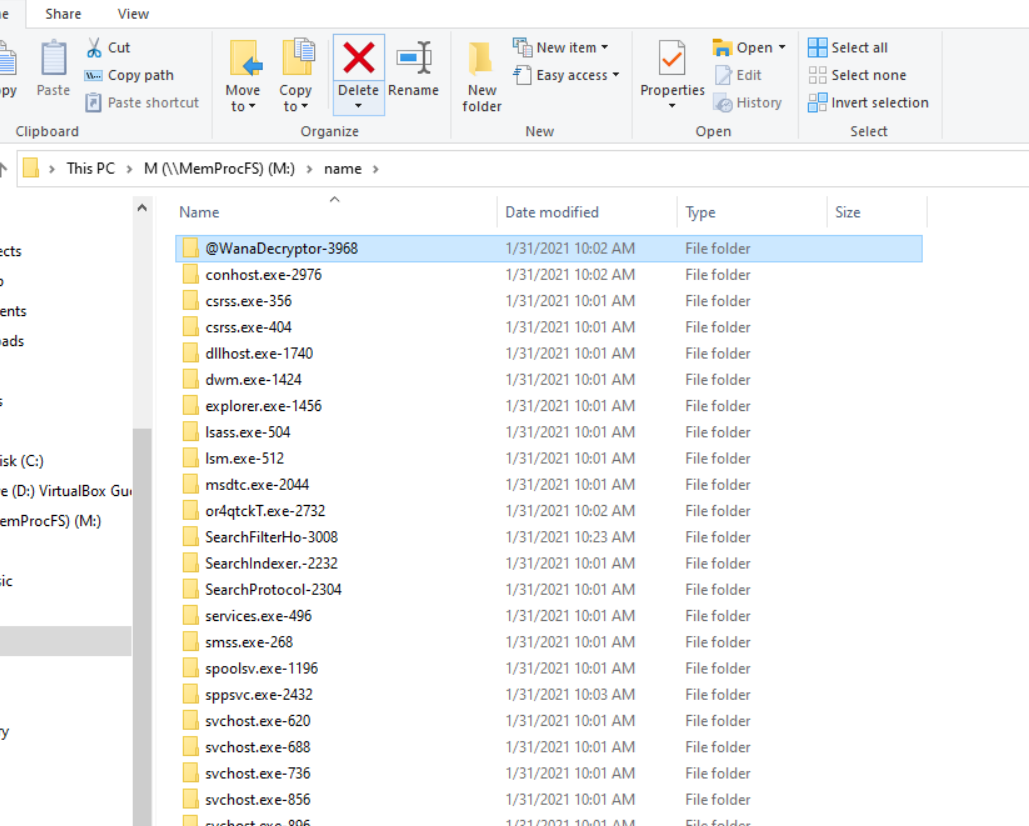
- list of the PIDs by name (dash the actual PID#)
/name/(randomprocess)
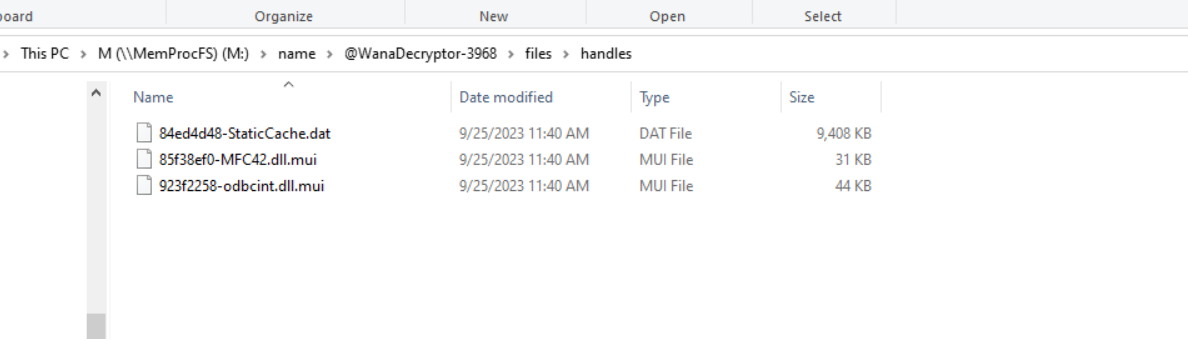
/name/(randomprocess)/files/handles
- what files was this process interacting with
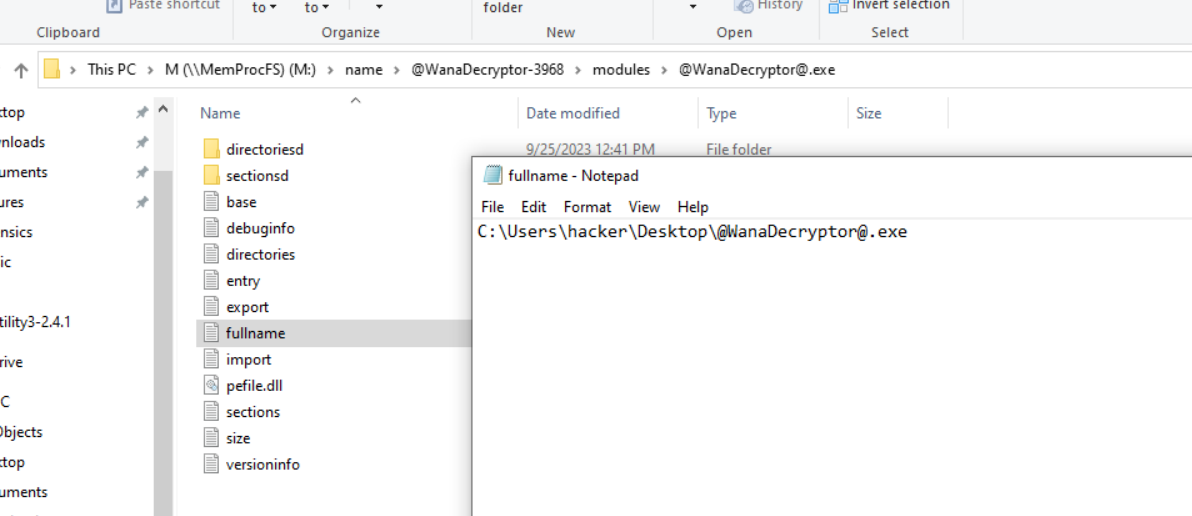
/name/(randomprocess)/files/modules
- what dlls was this process interacting with
/name/(randomprocess)/files/vads
- how Windows keeps track of what process memory is allocated to a process
/pid
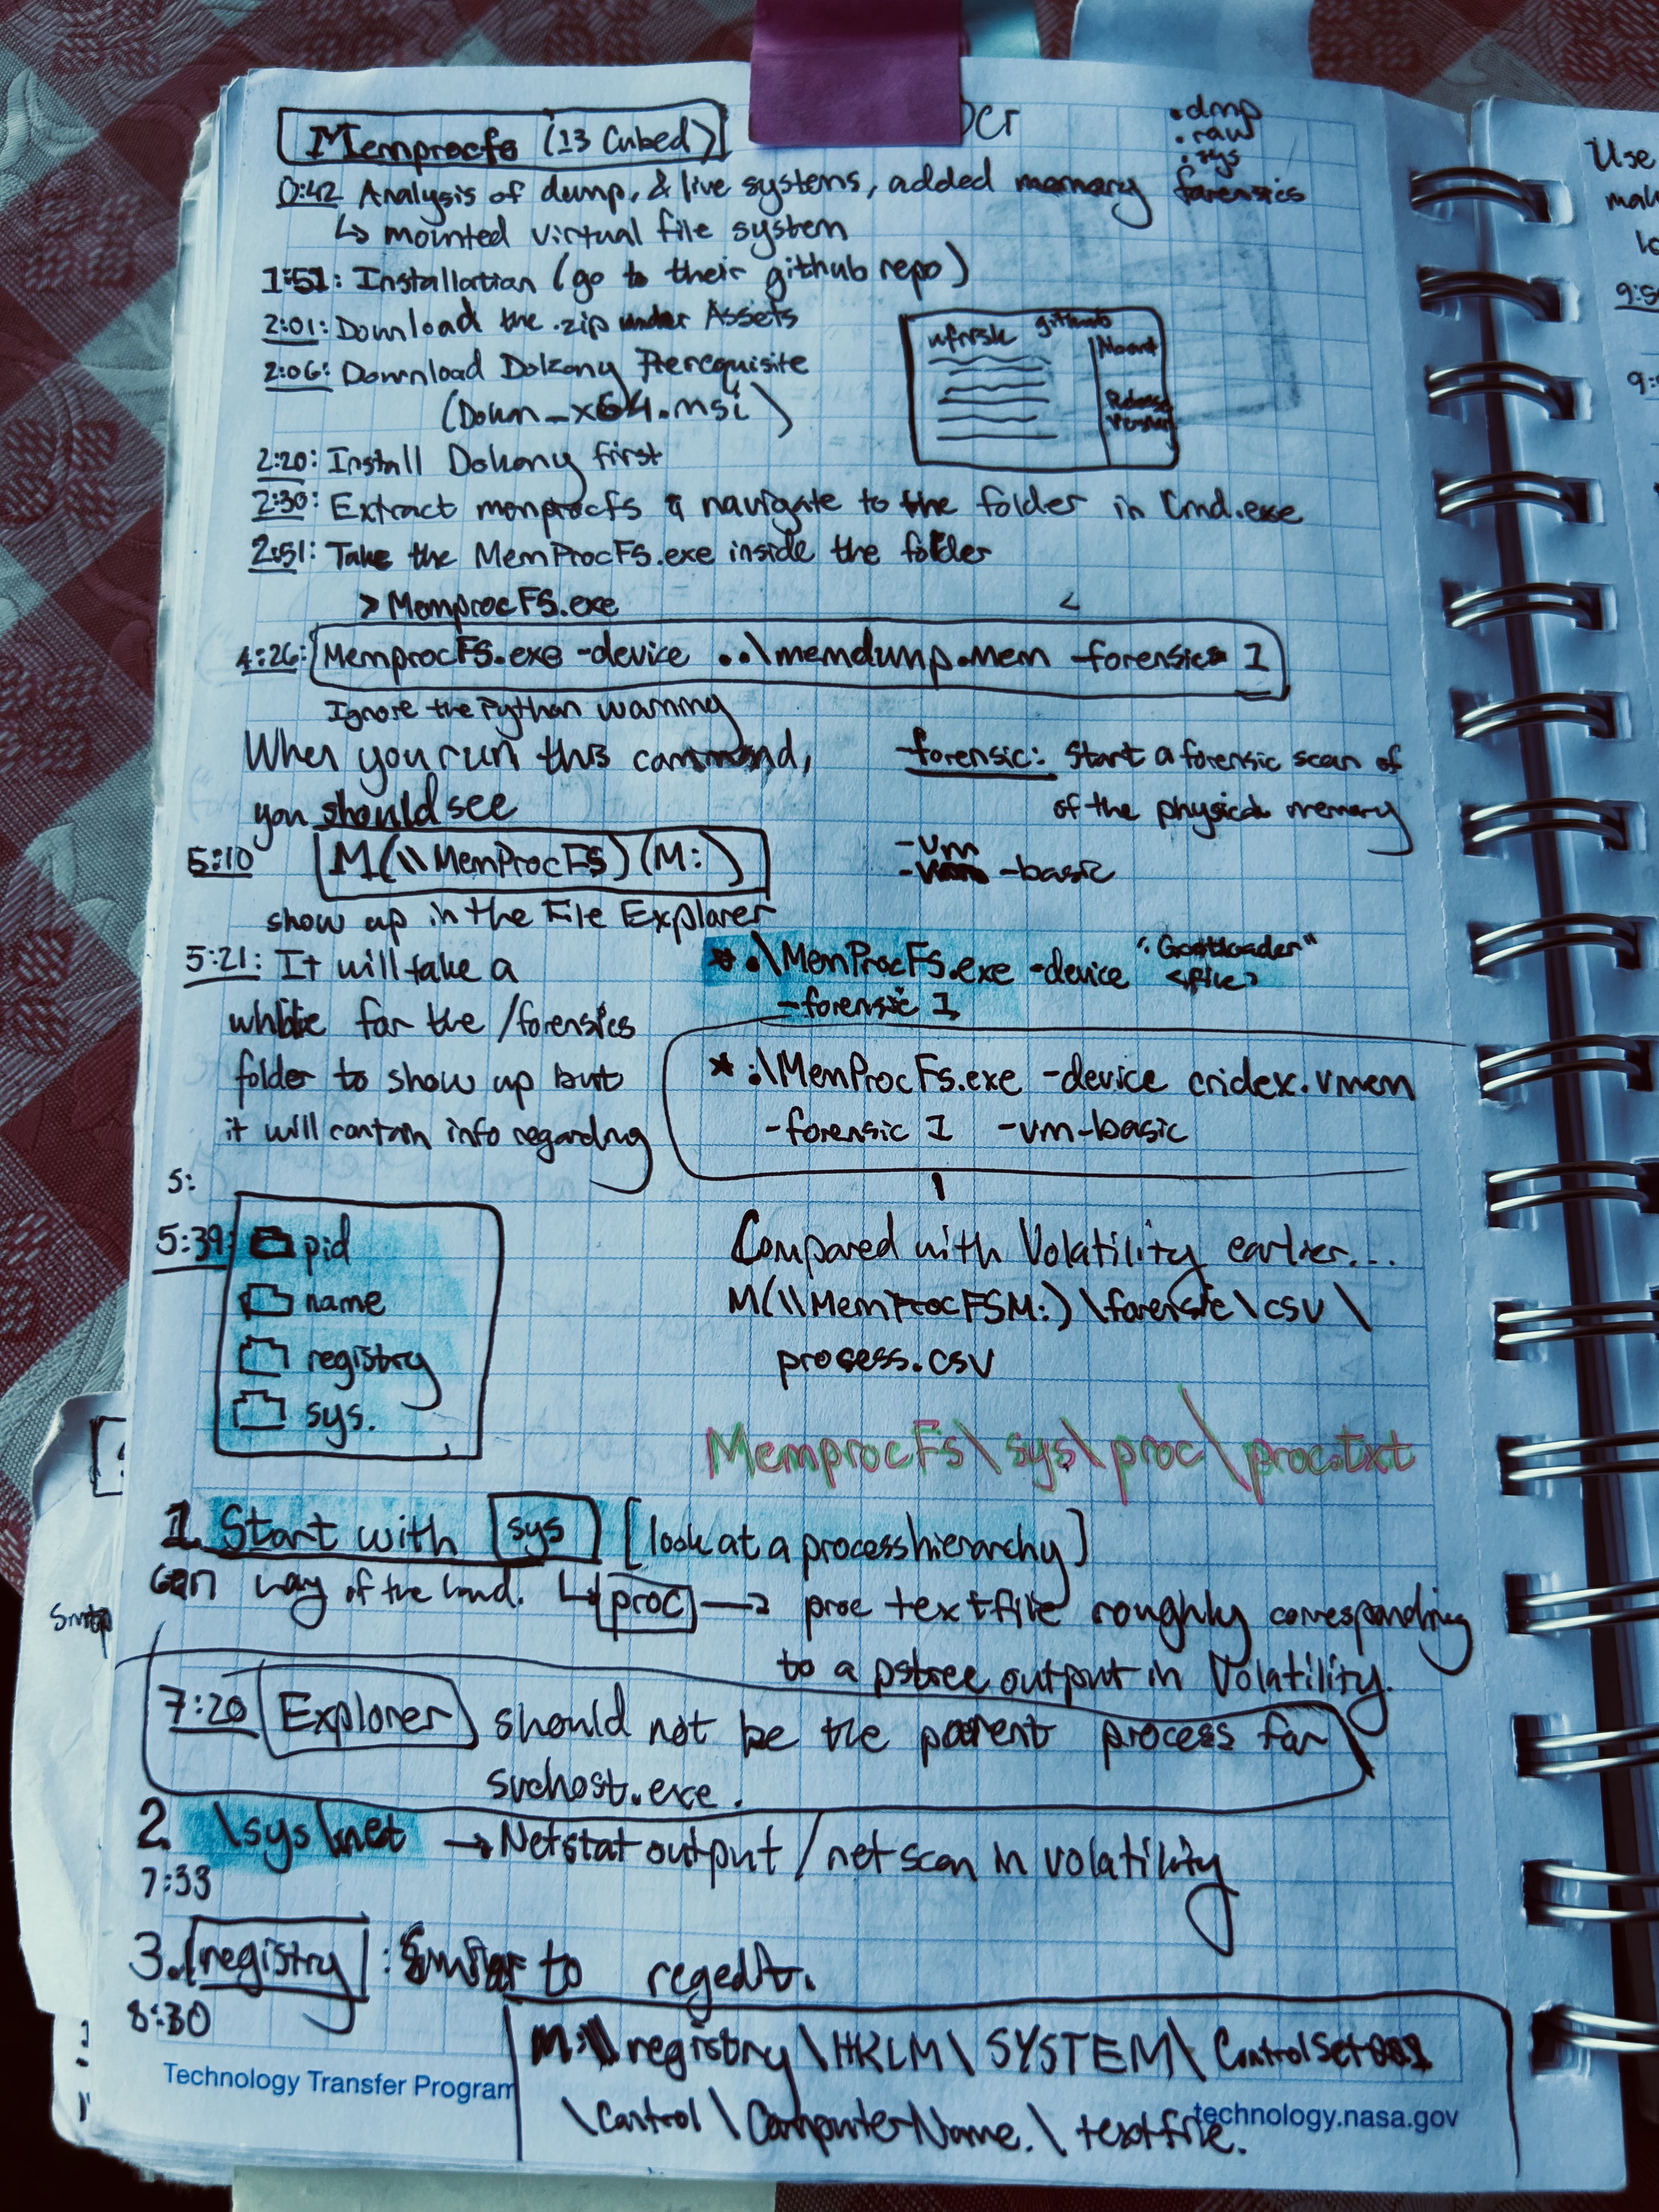 Raw Notes 1
 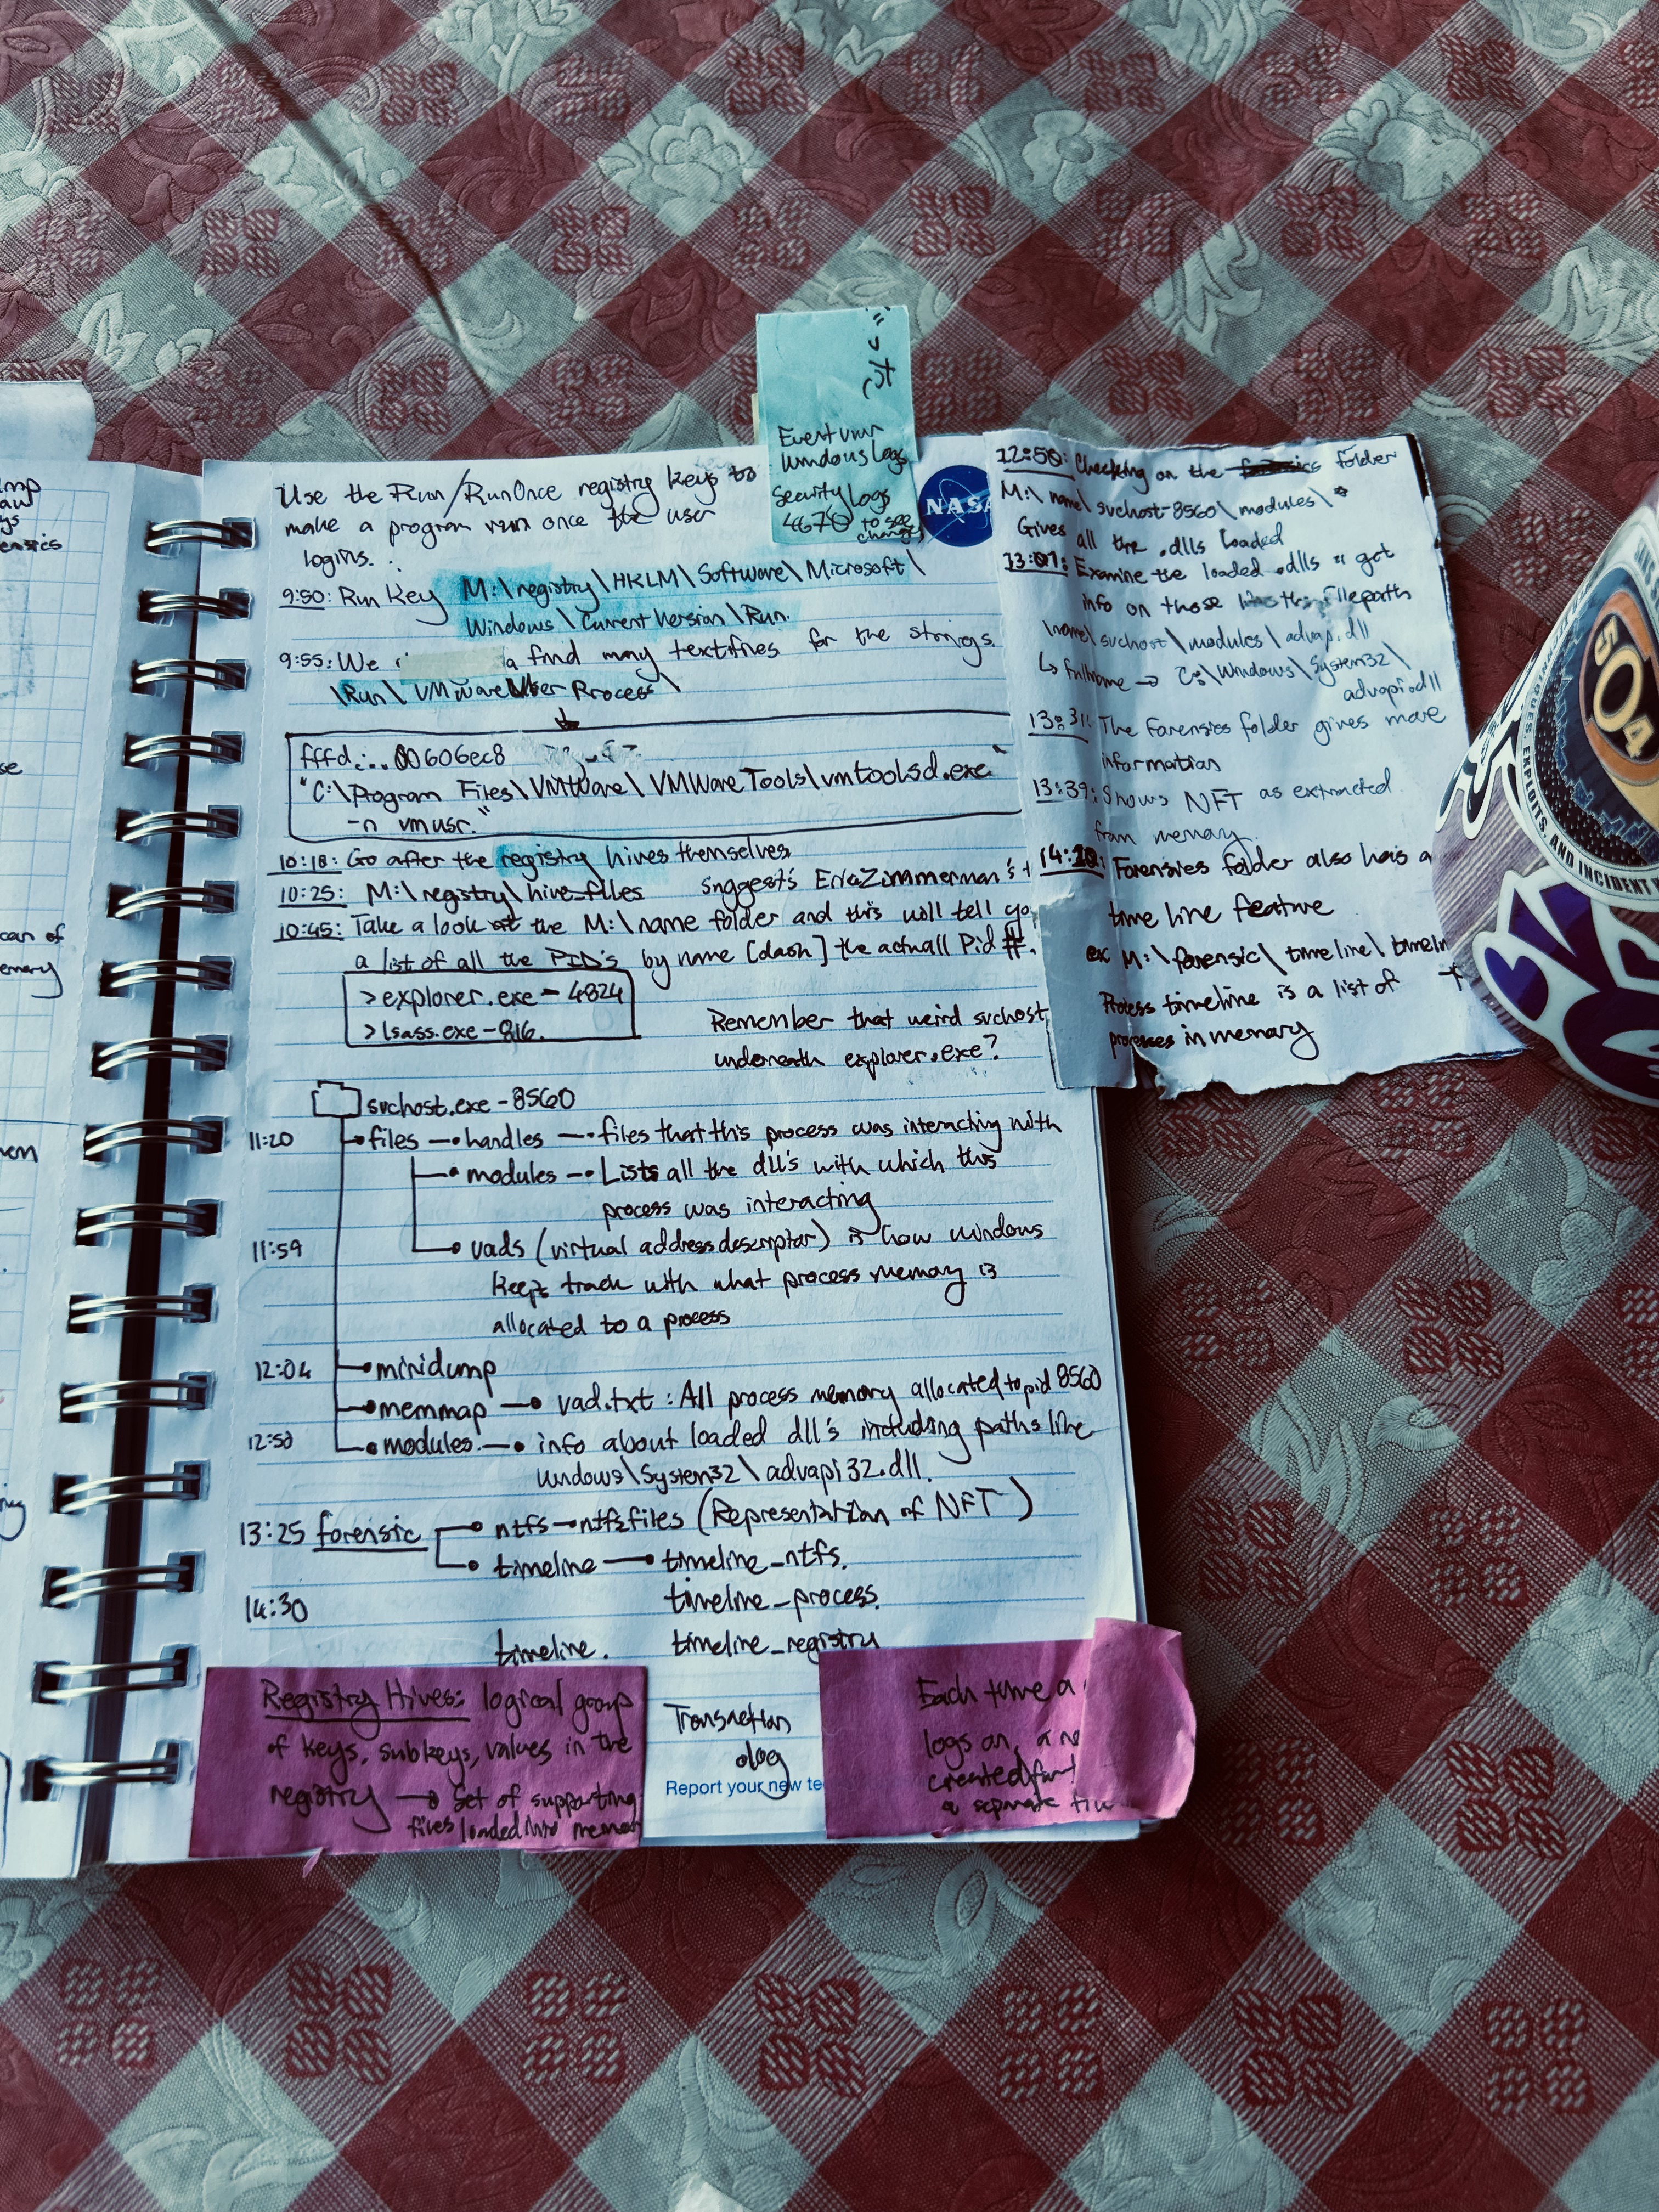 Raw Notes 2
 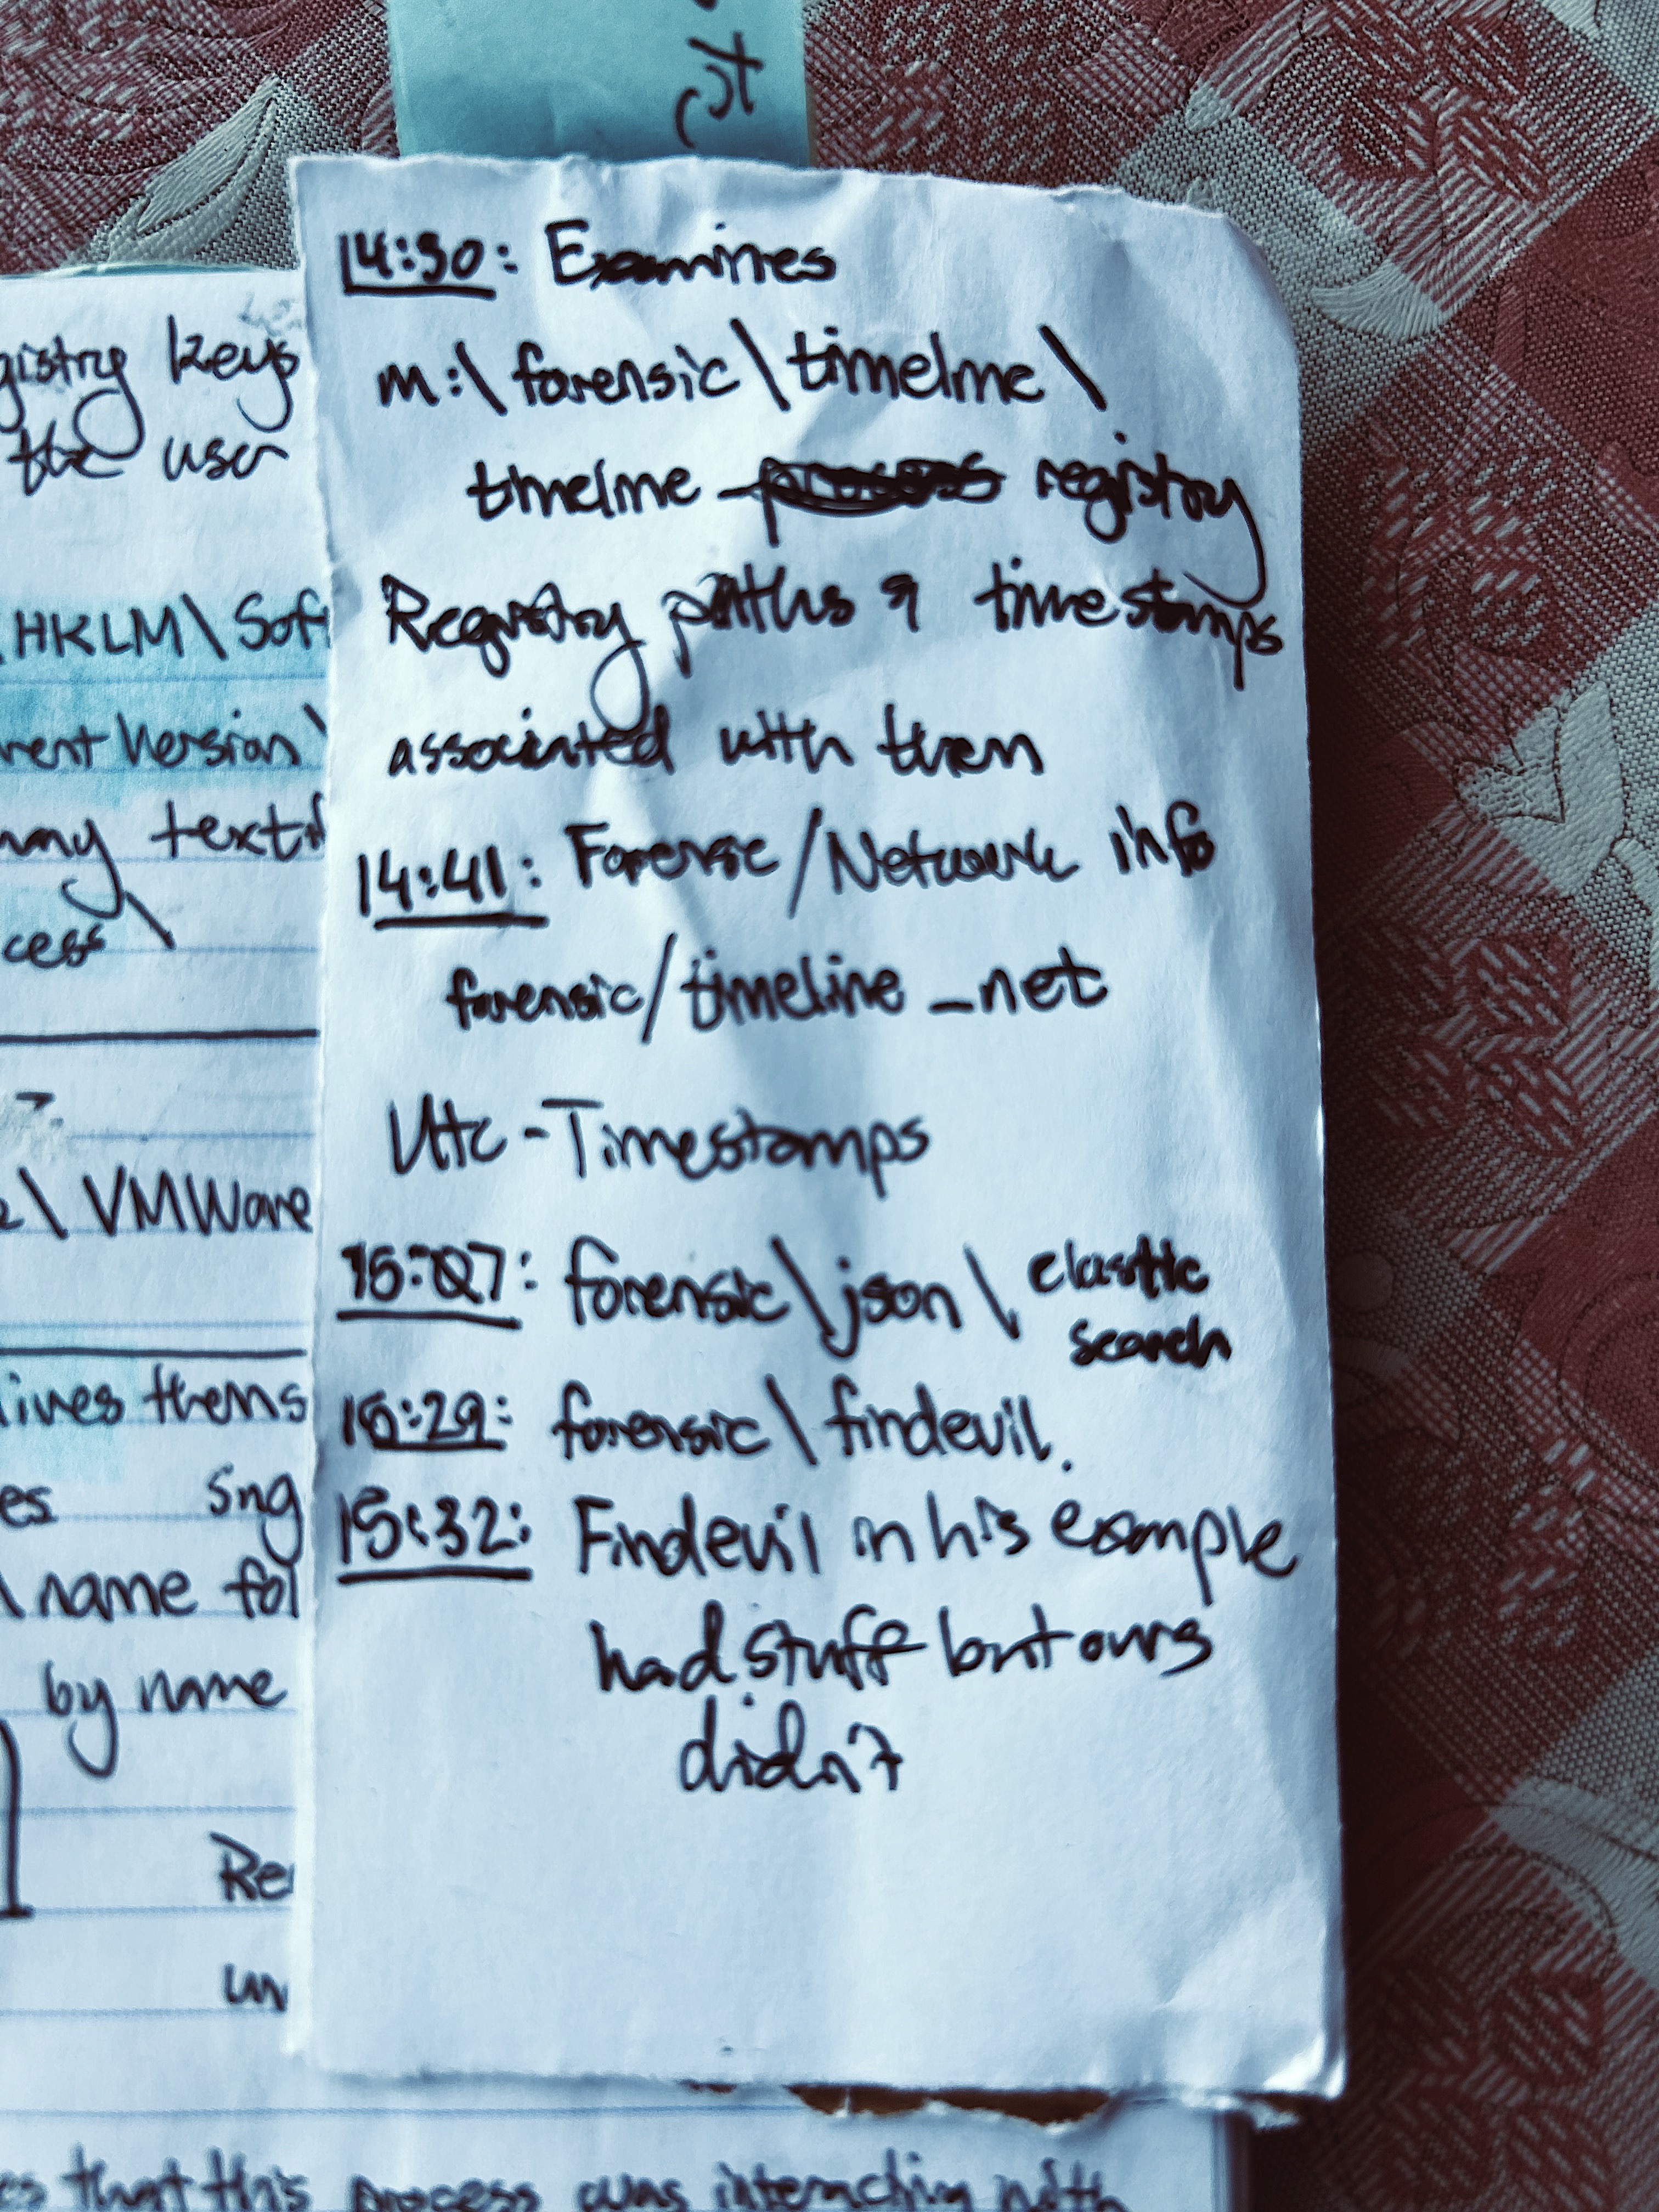 Raw Notes 3
Part 0: AKA Installation
This was the trickiest part IMO especially if you are some casual like me who has NO IDEA what forensics tools are like.
You will need an infected .vmem file, such as the cridex one in Volatility’s.
You will need to download MemProcFS off of their site along with installing Dokany .msi if you’re doing this on a Windows host
For me, I did this all on a Windows host.
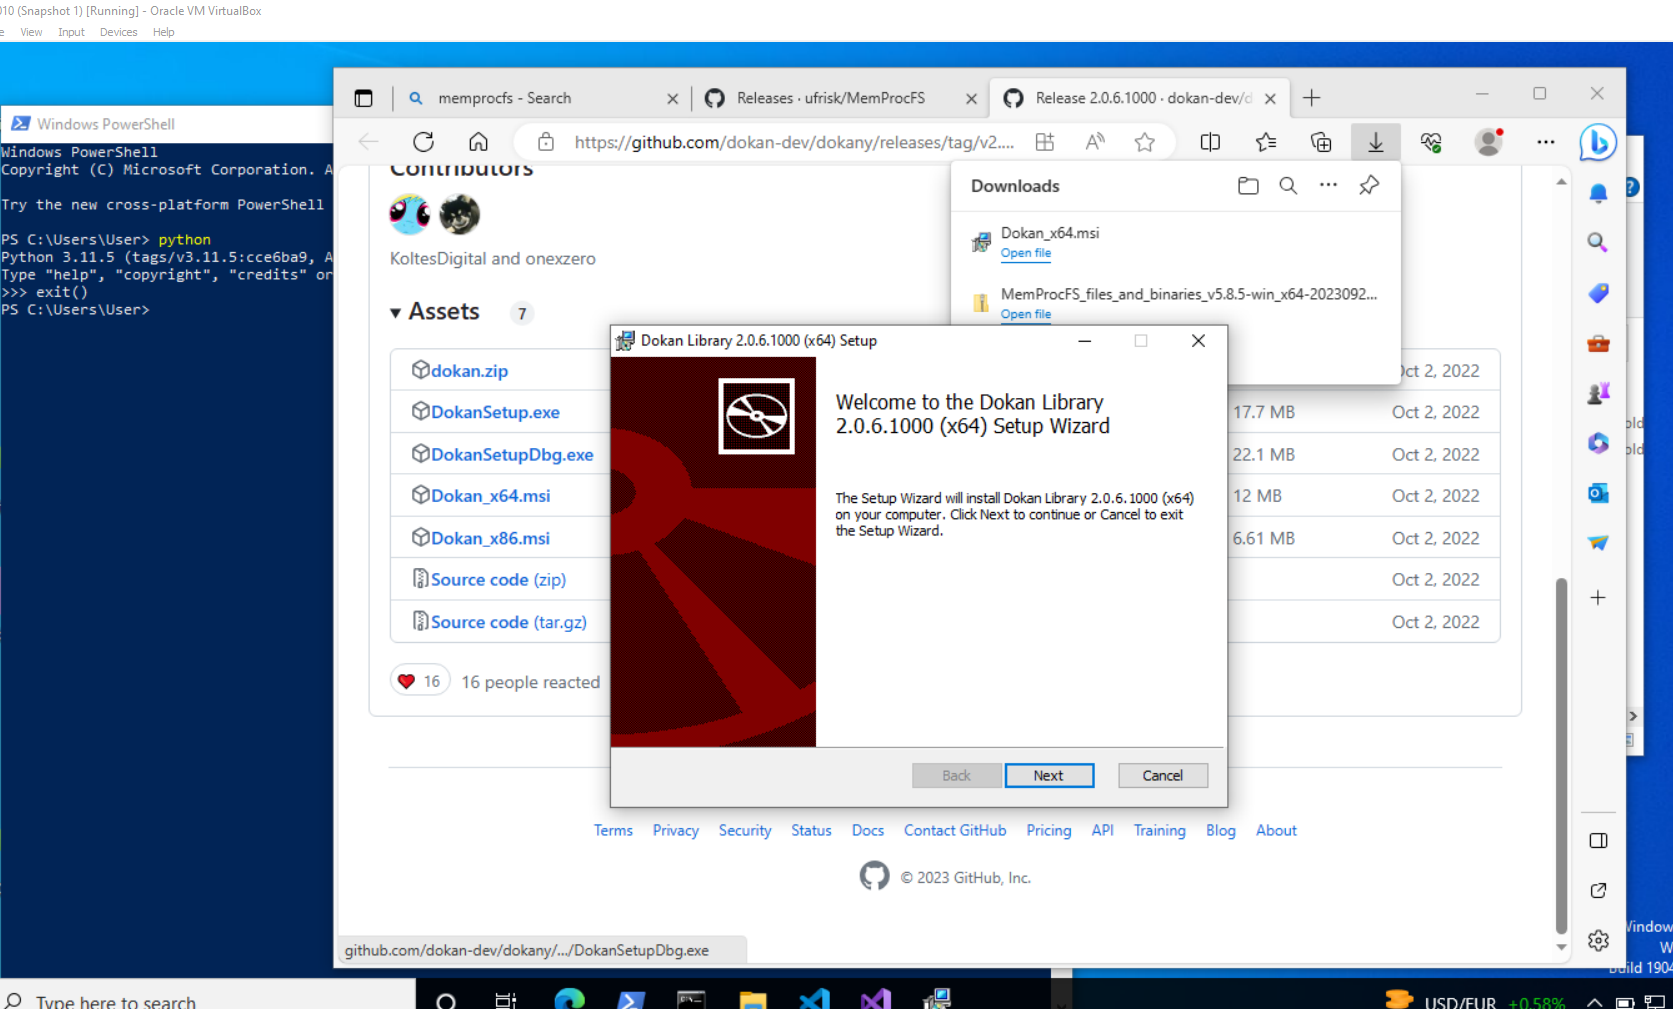 Installing Dokany
Download the .zip off of the github releases AND the Dokany msi
Unzip the file and then run the .exe from commandline/terminal/powershell
“…equating to the directories and files related to the MemProcFS forensic sub-system. The forensic sub-system is a collection of more thorough batch-oriented analysis tasks that may be undertaken on memory dumps.”
https://github.com/ufrisk/MemProcFS/wiki/FS_Forensic
Take Note: that .vmem file is that same cridex.vmem sample we used with Volatility.
Part 1: Running MemProc
 Running Memproc
1
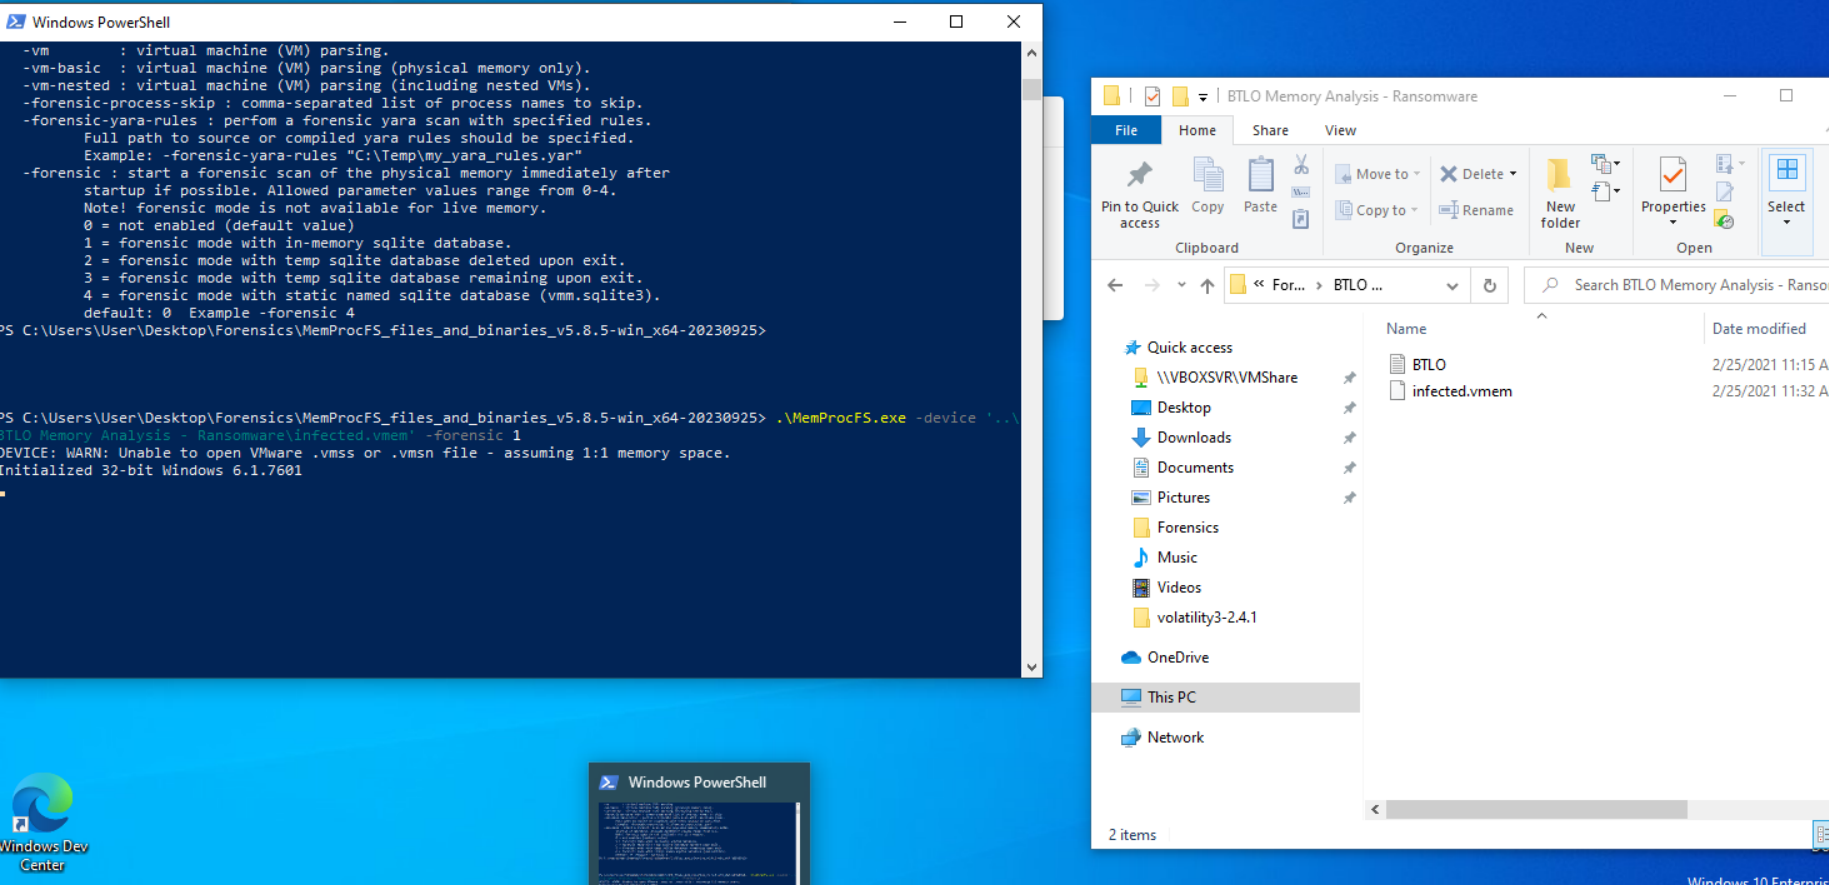
.\MemProcFS.exe -device '[.VMEM SAMPLE]' -forensic 1
-forensic Starts a forensic scan of the physical memory
-device [the .vmem image to examine]
MemProc will take a bit for the /forensics folder to show up but it will contain info regarding things like timelines of processes and dlls loaded.
When you run this it will seem like nothing is happening, and you can for now ignore the python warning. But if you look at your Windows directory, you will see the :\M image loaded for you to browse through like a file directory.
 Using the .vmem John Hammond used in his walkthrough
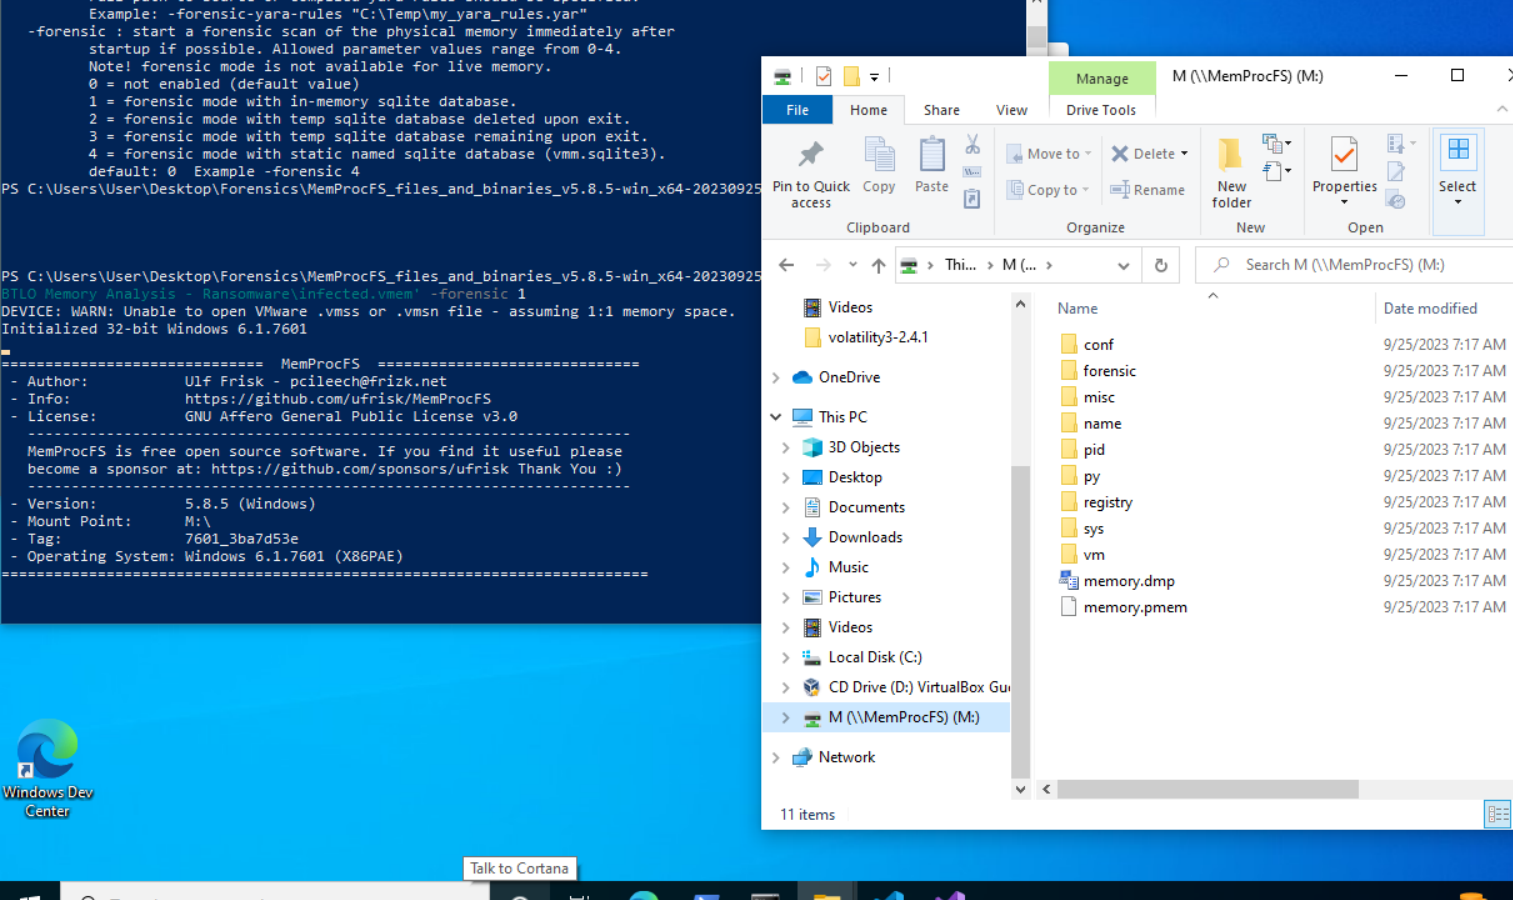
:M\ directory appearing
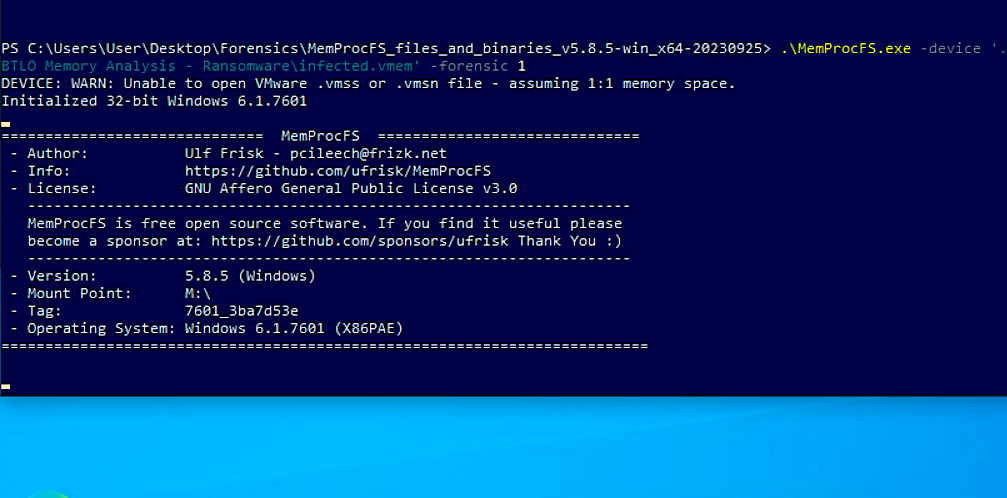
 The image getting mounted
Part 2: Running Through
5:30 is the approximate timestamp for when this starts.
Relevant directories:
1
2
3
4
/sys
/registry
/name
/pid
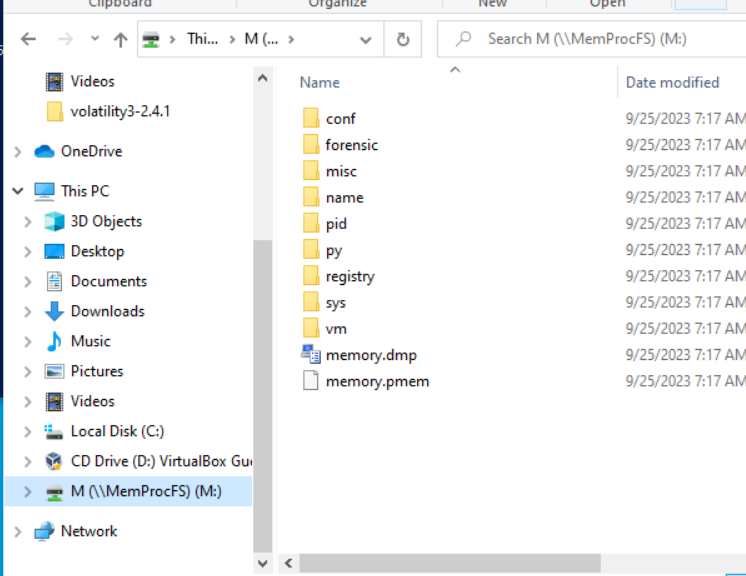 folder directory
\sys\ Folder
\sys\proc
Process hierarchy, textfile roughtly corresponding to a pstree output in Volatility
note: explorer should not be the parent process for svchost.exe
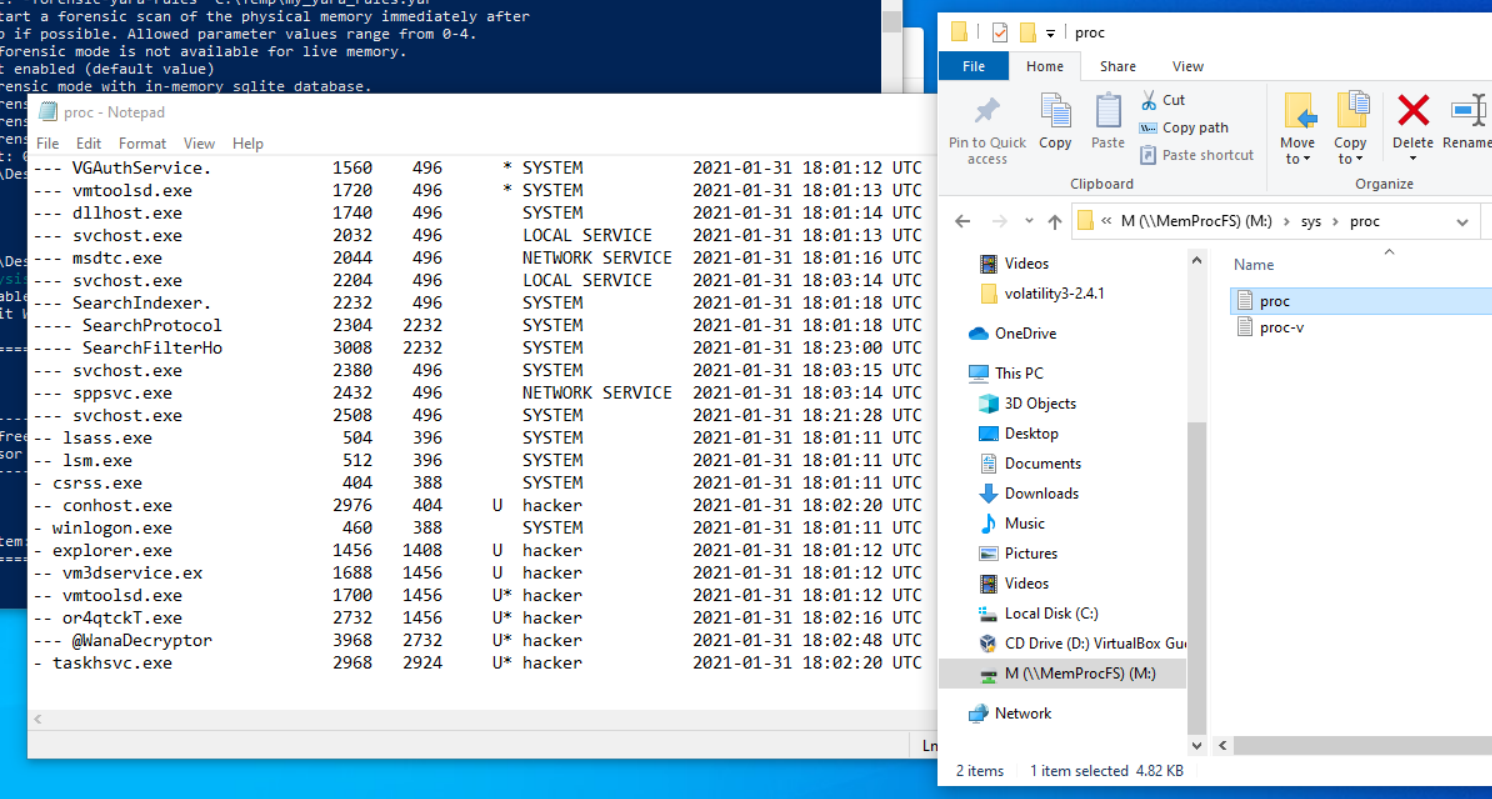 examining proc
\sys\net
Netstat output/netscan in volatility 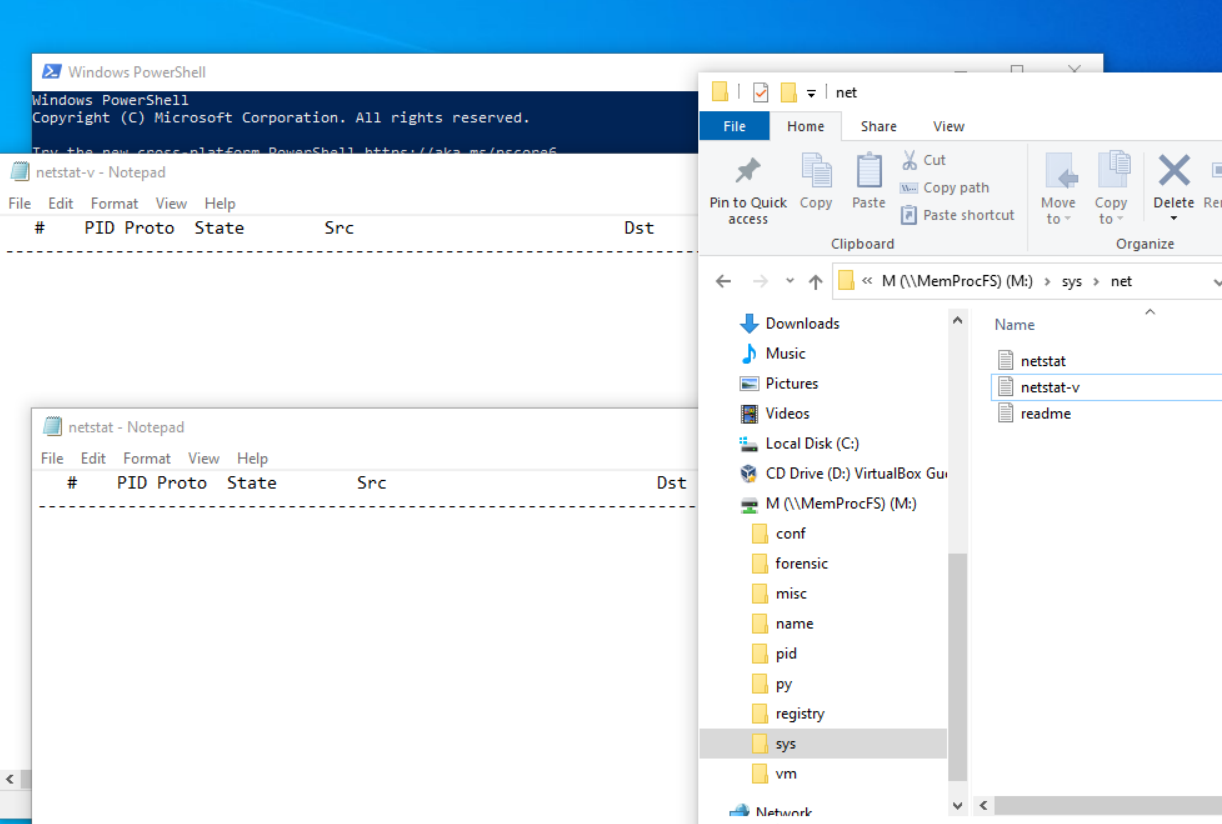 folder directory
\registry\ Folder
Similar to regedit
 folder directory
\registry...\Run\RunOnce
The Run/RunOnce registry keys make the program run once the user logs in
 folder directory
M:\registry\HKLM\Software\Microsoft\Windows\Current Version\Run
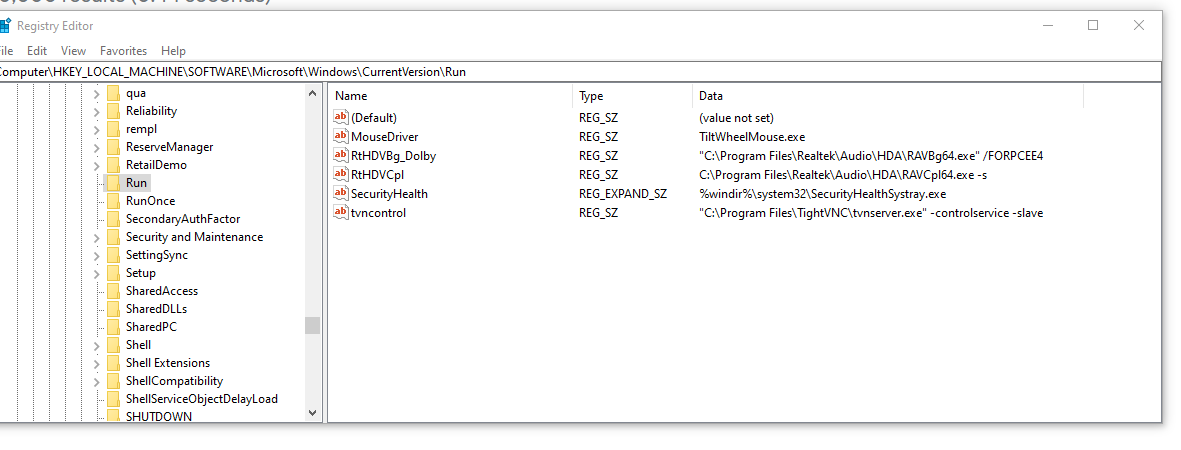 folder directory
list of the PID's by name (dash the actual PID #)
> Registry Hives: logical group of keys, subkeys, and values in the registry. Each time a new user logs on, a new hive gets created for that user with a separate file for the user
{: .prompt-tip }
### \name\ Folder
{: width="972" height="589" }
_folder directory_
/files/handles will tell you the files this process was interacting with
/files/modules will tell you all the dlls with which the process was interacting
/files/vads (virtual address descriptor) is how windows keeps track with what process memory is allocated to a process
{: width="972" height="589" }
_handles_
{: width="972" height="589" }
_folder directory_
## Part 3: M:/forensic Folder
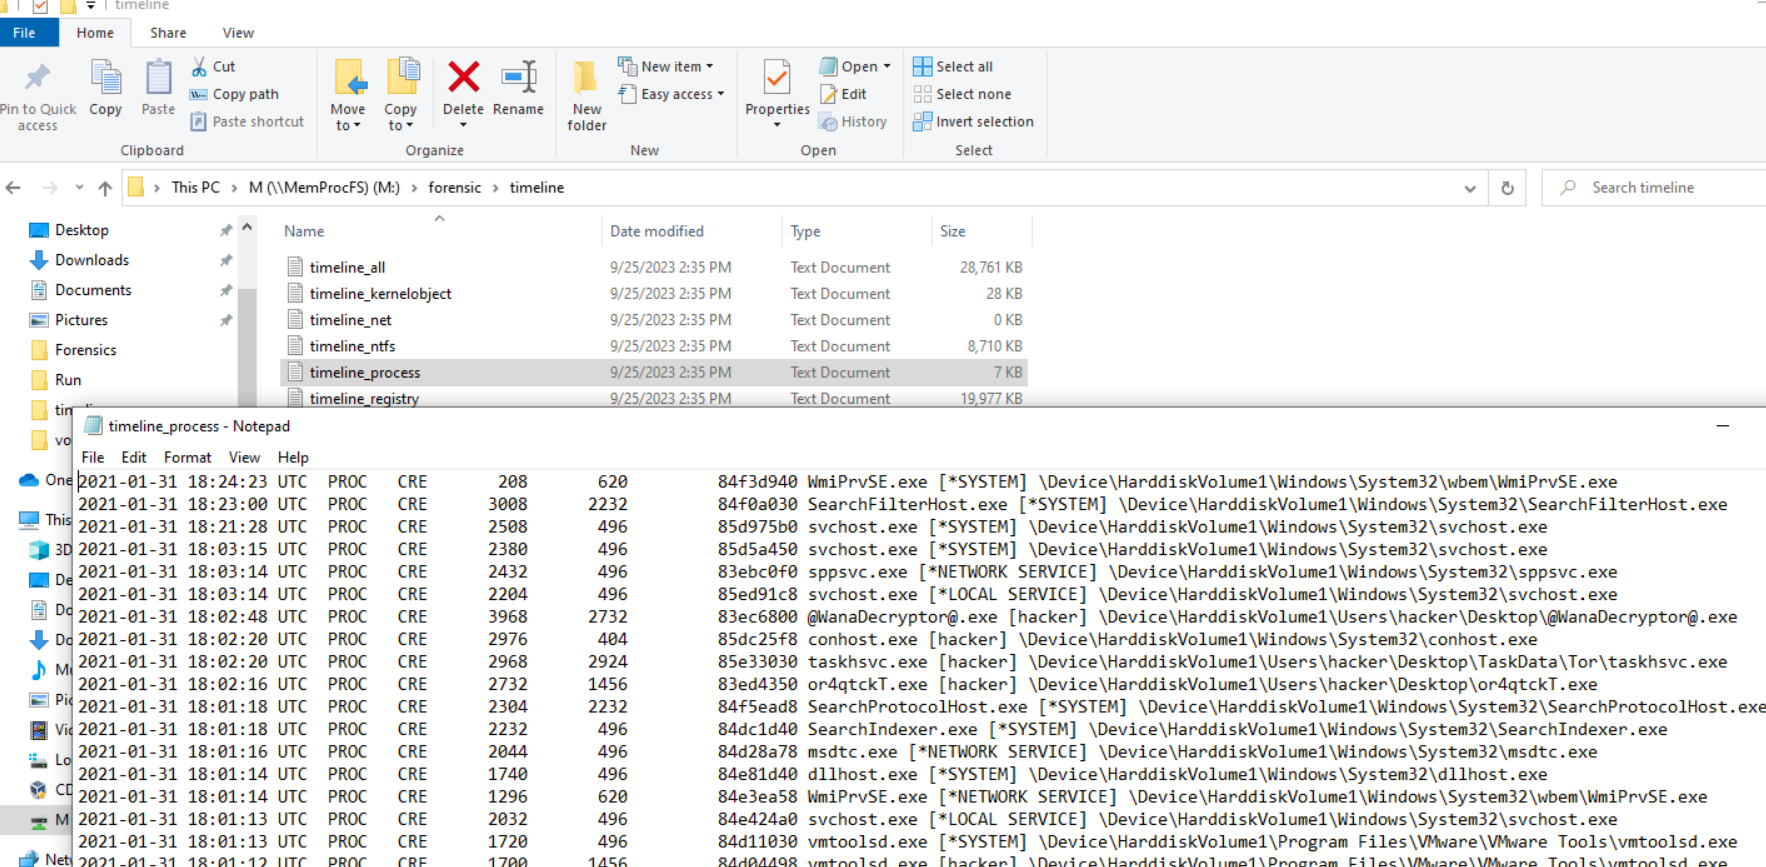{: width="972" height="589" }
_folder directory_
Forensic > Timeline is a list of processes in memory.
```console
M:\forensic\timeline\timeline_registry
M:\forensic\timeline\timeline_net
Registry paths and timestamps associated with them
1
forensic\findevil
Remember, this forensic folder may or may not be